Prometheus is an open source monitoring and alerting tool and is part of the Cloud Native Computing Foundation. Prometheus collects and stores its metrics as time series data. There are several tools that can be used to visualize this data. Grafana is often used for this purpose, which is also an open source platform.
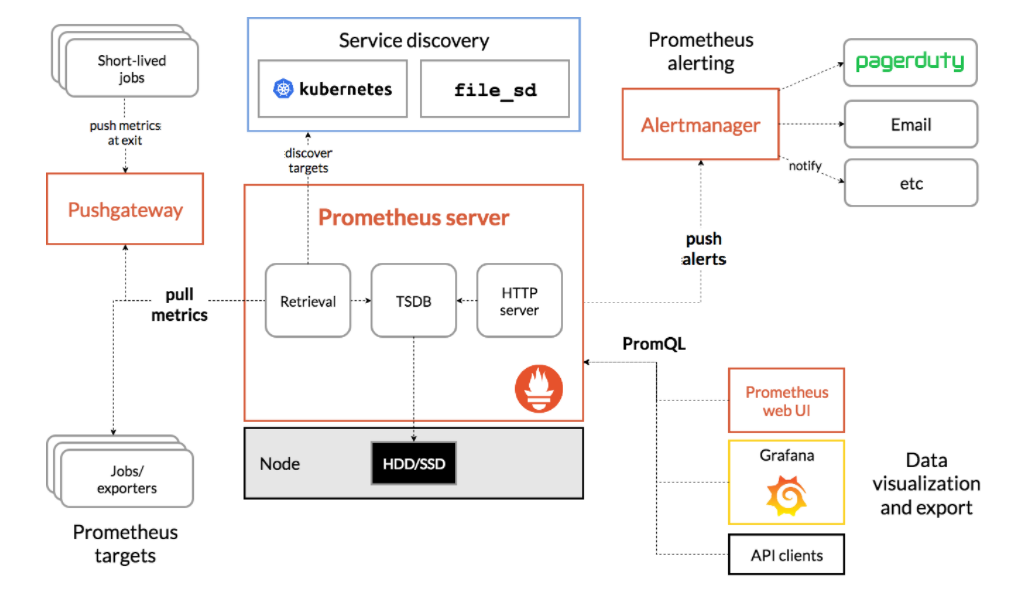
This diagram illustrates the architecture of Prometheus and some of its ecosystem components:
In this document we will show you how to install the Prometheus server, the Alertmanager and Grafana.
Now that our cluster is ready and we have downloaded the kubeconfig file, let’s verify that our cluster is up and running. To verify that you have a running master and worker node, list the nodes by executing:
If everything works, you should something similar to this:
Now we are ready to deploy Prometheus.
Installing the Prometheus Operator
We will be using Helm to install an operator for Prometheus. The operator manages the lifecycle of your Prometheus deployment.
Create a file to set the chart parameters. Specifically, we will expose Grafana so that you can reach it over the Internet.
Add the Prometheus community repository and update it:
Install the chart with the values file:
The output will look like this:
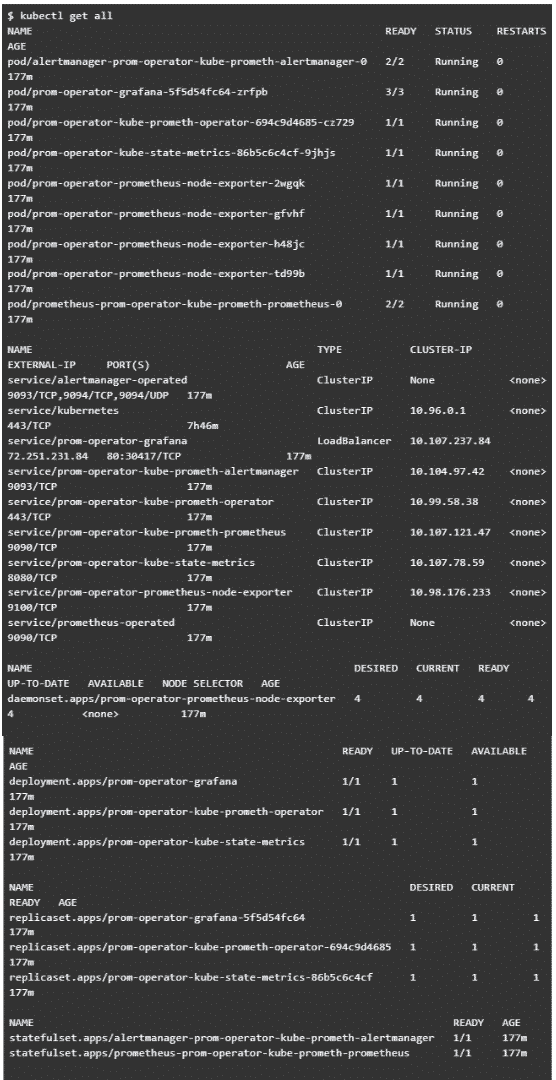
List the Kubernetes resources to see all the components of the Prometheus stack:
Accessing the Grafana User Interface
Look for the IP address of the Grafana service.
Use your browser to access this address. The login information is
Username: admin
Password: prom-operator
Select the Browse tab from the Dashboards menu:
Select one of the predefined dashboards. In this example we select the dashboard that shows the resource utilization of the pods in the cluster:


 Cloud U.Enroll in higher education at Ridge University