Elastic® is an in-memory data structure store which is often used as a distributed key-value store. Elastic® has a single master mode and multiple replicas. The master is the endpoint for write operations. Read operations can also be done from the replicas.
In this document we will show you how to easily install Elastic® Cloud Stack (ECK) in RKS.
Now that our cluster is ready and we have downloaded the kubeconfig file, let’s verify that our cluster is up and running. To verify that you have a running master and worker node, list the nodes by executing:
If everything works, you should something similar to this:
Now we are ready to deploy Elastic®.
Deploying Elastic® with Helm
In this tutorial we use a helm chart from Elastic. First, add helm repo.
Update the repo:
We start by using the helm chart that deploys an operator and new custom resource definitions(CRDs).
All the resources will be created in a separate namespace called elastic-system. To see all the resource that were created use:
The result will look like this:
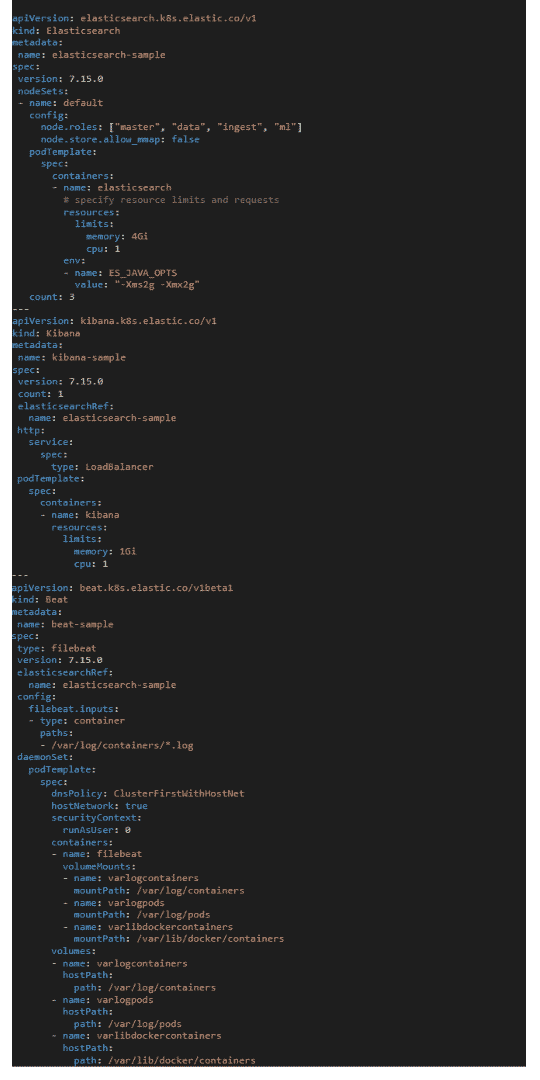
Now that the operator is running, we can create the Elastic resources using a resource definition file. Here is an example file that will deploy Elasticsearch, Kibana and Beats:
Apply this file in the elastic-system namespace:
The result will look like this:
The operator will now start provisioning these resources. It will take some time until the entire stack is ready. You can monitor this by using:
It will show the status of the different stack components:
Let’s take a look at all the native Kubernetes resources that were created:
Notice that
There are three replicas of Elasticsearch
There is a filebeat pod on each node so that files can be collected from all nodes
The Kibana service has an external IP allowing access from the Internet
You can also see this in the Ridge console when you select the ‘Load Balancer’ tab of the the cluster
Accessing Kibana®
Accessing Kibana® requires a password. Retrieve the password with:
Enter the following URL in your browser:
Your browser will present the login page, Use the password you extracted from the secret and the user ‘elastic’:
After you successfully login you will land on the welcome page:
Example-Visualizing Container Logs
From Kibana’s console you can easily analyze and visualize the information that you collected in Elasticsearch. In this section we provide a simple example with the container of files that Filebeats collected from the Kubernetes nodes.
Press the ‘ADD Data’ button in the welcome page. Next, select ‘Discover’ from the sidebar
You should get a page indicating that there is already data in Elasticsearch. This is thanks to the Filebeat pods on each nose that collect the container log files.
Next, create an index pattern for the data. Select filebeat-7.15.0 as the source and @timestamp as the timestamp field. Then press the ‘Create Index Pattern’ button.
To create a simple dashboard that will show how many log entries each container has, go to the ‘Dashboard’ from the sidebar.
Press the ‘Create New Dashboard’ button. In the page that follows, press ‘Create Visualization’
You can now drag any of the available fields into the visualization area. Here is an example when we dragged log.file.path. The right panel controls how the data will be visualized. The parameter we chose is the log of a container therefore each bar represents a container and we chose to display the ones with the most log entries. You can see that the Kibana container has the most entries.
By additionally dragging the host_name parameter, you can now also see on which node the container was running.


 Cloud U.Enroll in higher education at Ridge University